PE Ratios and the Impact they have on Returns
- kyleelamb1324
- Feb 1, 2022
- 4 min read
Updated: Feb 14, 2022
PE Ratios and the Impact they have on Returns - Kyle E. Lamb

Problem Statement:
Can PE ratios be used to explain some of the variance in the stock market? How strong is the correlation?
Most equity investors have heard or used the PE ratio in their investing strategies. It is possibly the most common metric for determining the value of a company. To recall, the PE ratio represents the multiple that investors are currently willing to pay for a share in the companies future earnings. If a companies earnings are expected to grow rapidly, an investor might be more inclined to pay a higher multiple relative to a slower growing company. This sentiment is what drives the market up or down. If the majority of investors were correct about the future earnings of a company, then we can assume that the earnings growth has already been priced in and there is no further value to be gained. On the other hand, if investors sentiment was incorrect, meaning they misjudged the future earnings of a company, it can result in over or undervalue, hence there is value to be gained.
In a Nutshell:
This project will attempt to determine whether low PE ratios correlate with future returns and whether any value can be extracted from stocks with low PE ratios compared to High PE ratios. I will also cover a selection of different industries and market caps to determine whether there is a stronger dependence among different regions of the stock market.
Data Gathering and Visualization:
I will be using two data sources for this project, one for analyzing the S&P500 and the second for analyzing individual sectors. The data sources can be found here:
For the S&P500 analysis we have the following dataset:

For sector analysis, I want to determine whether some sectors have a stronger correlation than others. I will be looking at a selection of different sectors as well as small, mid, and large cap stocks. For each sector/market cap, I have chosen the following ETFs to represent them and their corresponding holdings.
Small Cap - Ishares Russel 2000 ETF
Mid Cap - Ishares Core S&P Mid-Cap ETF
Large Cap - Ishares Core S&P500 ETF
Consumer Staple - Ishares Global Consumer Staples ETF
Tech - Ishares U.S. Technology ETF
Real Estate - Ishares U.S. Real Estate ETF
Industrial - Ishares U.S. Industrial ETF
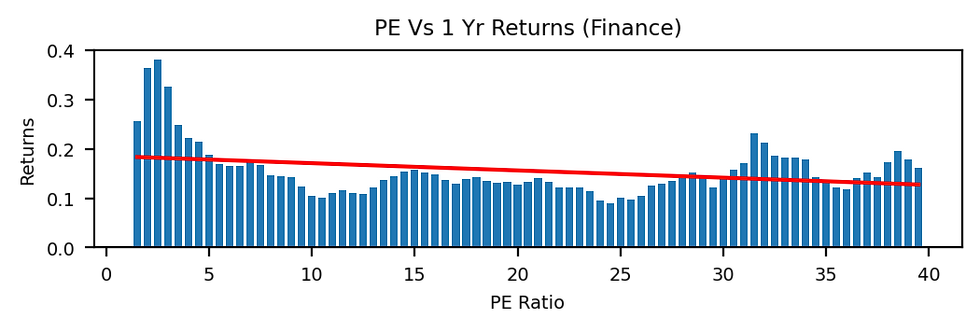
Finance - Ishares U.S. Financials ETF
S&P500 Analysis:
Rolling up the markets PE ratio can be an effective way to determine the value of the overall market. The Shiller PE ratio takes the price of the S&P500 and divides by the average earnings over the last ten years. When this ratio increases, it is called a market expansion. When it decreases, it is a market contraction. During periods of expansions, investors are more inclined to pay a higher multiple compared to periods of contractions, which leads to over and undervalued markets. Here is the plot of the Shiller PE ratio over the last seventy years.

Below represents what happens to market returns during periods of contraction and expansion. If there is value to be gained by the PE ratio, then we should see that market returns are lower when the PE ratio is higher. Below is the plot of the Shiller PE vs 5 YR CAGR for the S&P500.

The downward sloping linear regression indicates that there is an inverse correlation for returns and the Shiller PE ratio. To evaluate the strength of the correlation, we will look at a common statistical metric for correlation, R2. The R2 value for this model is 23.01%. R2 values typically depend on the type of research that is being conducted. In the scientific community, an R2 > 30% and R2 < 50% is considered a weak affect. Due to the large variability in the stock market, I would consider this R2 value to be moderate to weak. It can be used to explain a small portion of the variance in the market. Overall, there is a slight correlation which is what we are looking for as investors to create an edge in our investment strategies.
Sector Analysis:
For sector analysis, we will do the same that we did for the overall market analysis, except we wont have access to ten year rolling average earnings. We will be using a trailing twelve month EPS as our metric. Below are the results for large cap stocks:

R2 = 49.33%
Slope = -.316%
To better view the data, I averaged the returns for each 2.5 interval of PE ratios from 0 to 40. With an R2 of 49.32%, we can see that there is a stronger correlation here than the overall market. The slope of the linear regression is -.316%, which means that as PE ratios increase by 2.5, we can expect a -.316% drop in returns on average.
To view each sector together, it might be more effective to view as a table. I sorted each sector according to their corresponding R2 values from left to right.
Note: NaN values are due to limited data in that range of PE.
From the data, we can see that industrial and small cap stocks have the highest correlation. It is important to point out that the slope among these two sectors is also high. This means that for each increase in PE ratio it will have a greater impact on our returns compared to the other sectors. All plots for each sector can be seen at the bottom of the page.
Bottom Line:
Although not every sector showed promising results, it is safe to say that PE ratios have medium to strong correlation with returns for the majority of sectors covered, with small cap and industrial stocks being the most correlated. If an investor is looking to add PE ratios as part of their strategy, it is important to know for certain whether you can add value to your portfolio by using PE ratios. In this study it is shown that buying low value industrial and small cap stocks is the best way to add value based on the PE ratio.


Comments